Enable O11y Addons
Before installing observability addons, we recommend you to start from the introduction of the observability feature.
Quick Start
To enable the observability addons, you simply need to run the vela addon enable commands as below.
- Install the kube-state-metrics addon
vela addon enable kube-state-metrics
- Install the node-exporter addon
vela addon enable node-exporter
- Install the prometheus-server addon
vela addon enable prometheus-server
- Install the loki addon
vela addon enable loki
- Install the grafana addon
vela addon enable grafana
- Access your grafana through port-forward.
kubectl port-forward svc/grafana -n o11y-system 8080:3000
Now you can access your grafana by access http://localhost:8080 in your browser. The default username and password are admin and kubevela respectively.
You can change it by adding
adminUser=super-user adminPassword=PASSWORDto step 6.
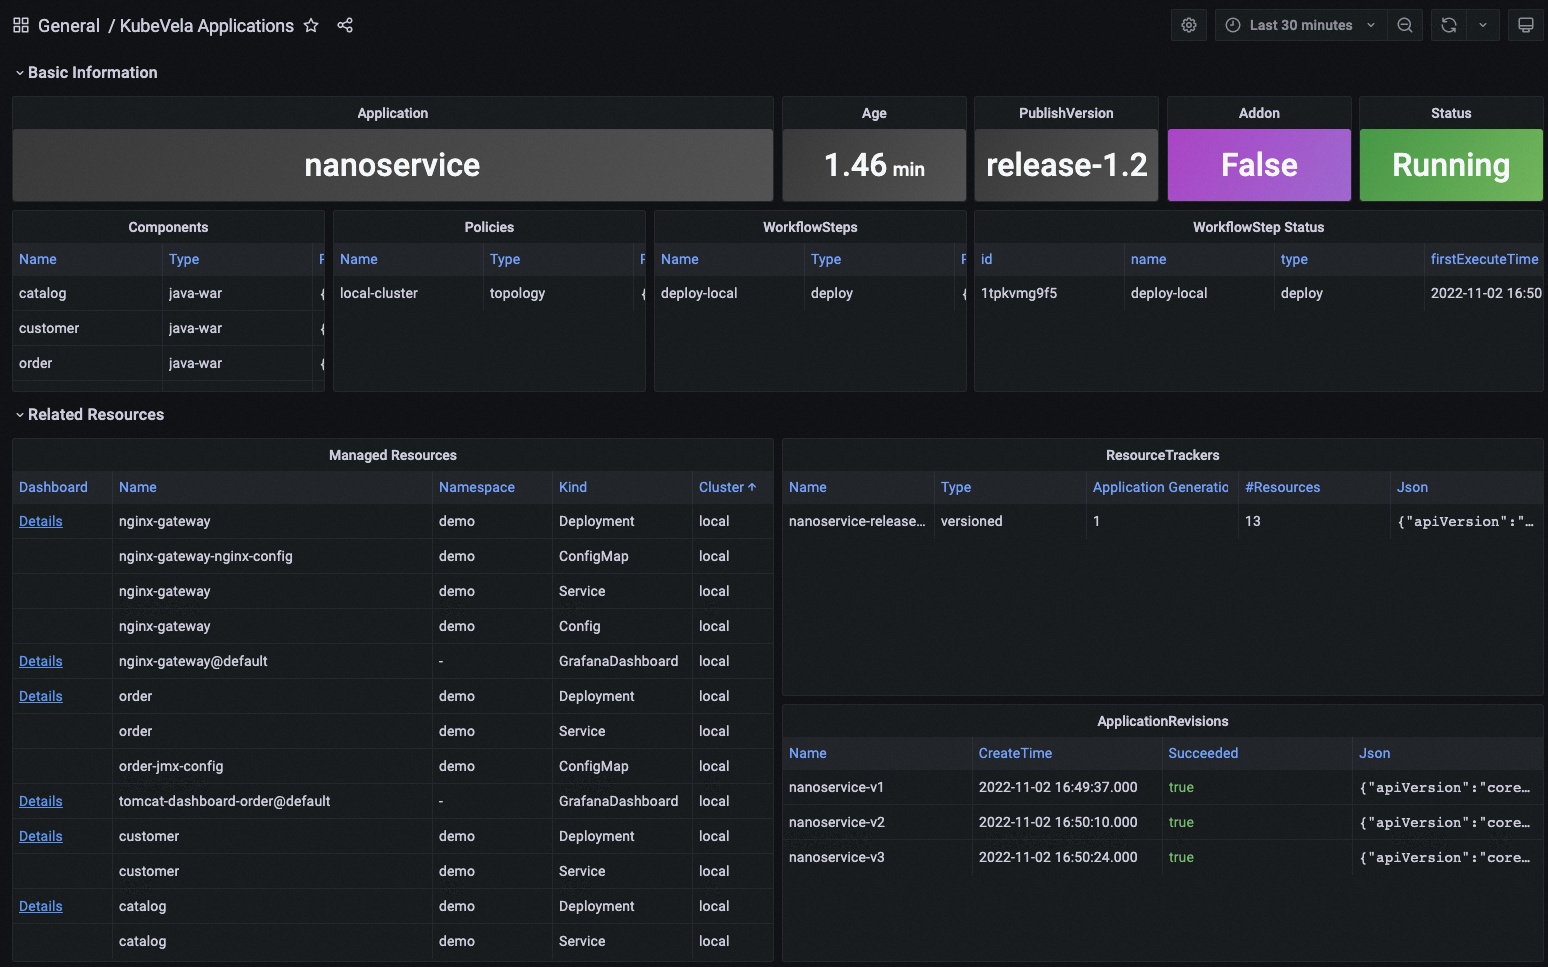
You will see several pre-installed dashboards and use them to view your system and applications. For more details of those pre-installed dashboards, see Out-of-the-Box section.
Resource: The observability suite includes several addons which requires some computation resources to work properly. The recommended installation resources for you cluster are 2 cores + 4 Gi memory.
Version: We recommend you to use KubeVela (>= v1.6.0) to use the observability addons. For version v1.5.0, logging is not supported.
Addon Suite: If you want to enable these addons in one command, you can use WorkflowRun to orchestrate the install process. It allows you to manage the addon enable process as code and make it reusable across different systems.
Multi-cluster Installation
If you want to install observability addons in multi-cluster scenario, make sure your Kubernetes clusters support LoadBalancer service and are mutatually accessible.
By default, the installation process for kube-state-metrics, node-exporter and prometheus-server are natually multi-cluster supported (they will be automatically installed to all clusters). But to let your grafana on the control plane to be able to access prometheus-server in managed clusters, you need to use the following command to enable prometheus-server.
vela addon enable prometheus-server thanos=true serviceType=LoadBalancer
This will install thanos sidecar & query along with prometheus-server. Then enable grafana, you will be able to see aggregated prometheus metrics now.
You can also choose which clusters to install addons by using commands as below
vela addon enable kube-state-metrics clusters=\{local,c2\}
For loki addon, the storage is hosted on the hub control plane by default, and the agent (promtail or vector) installation is multi-cluster supported. You can run the following command to let multi-cluster agents to send logs to the loki service on the local cluster.
vela addon enable loki agent=vector serviceType=LoadBalancer
If you add new clusters to your control plane after addons being installed, you need to re-enable the addon to let it take effect.