Out-of-Box System Observability
By default, a series of dashboards are pre-installed with the grafana addon and provide basic panels for viewing observability data. If you follow the installation guide, you should be able to use these dashboards without further configurations.
Dashboards
KubeVela Application
This dashboard shows the basic information for one application.
URL: http://localhost:8080/d/application-overview/kubevela-applications
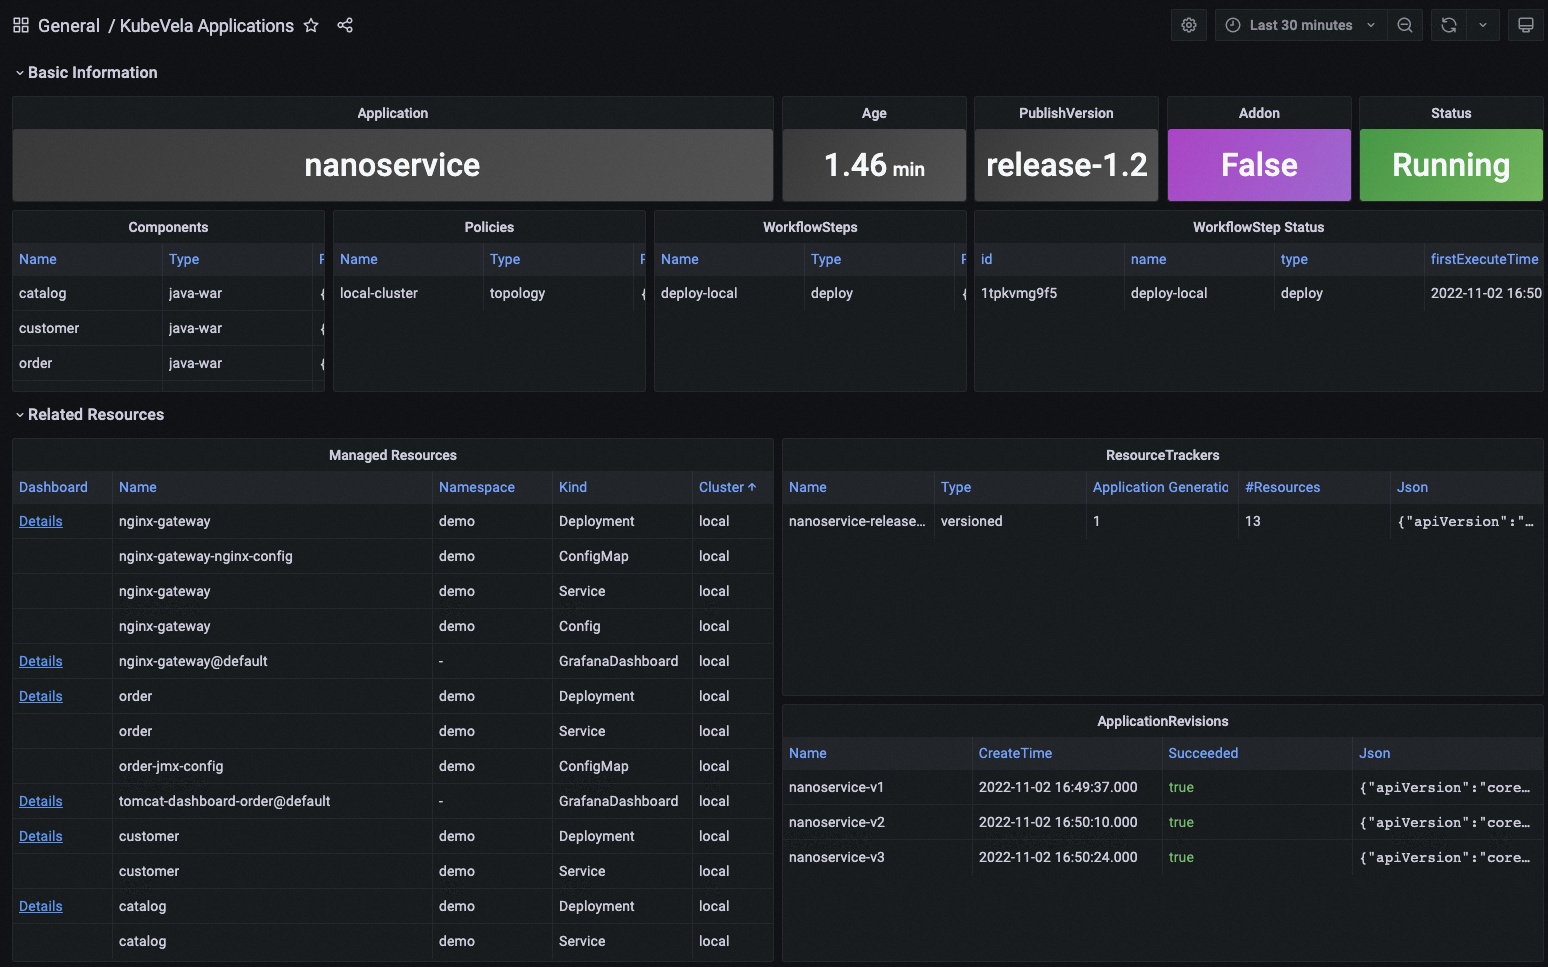
The KubeVela Application dashboard shows the overview of the metadata for the application. It directly accesses the Kubernetes API to retrieve the runtime application information, where you can use it as an entrance. You can navigate to detail information for application resources by clicking the Details link in the Managed Resources panel.
The Basic Information section extracts key information into panels and give you the most straightforward view for the current application.
The Related Resources section shows those resources that work together with the application itself, including the managed resources, the recorded ResourceTrackers and the revisions.
Kubernetes Deployemnt
This dashboard shows the overview of native deployments. You can navigate deployments across clusters.
URL: http://localhost:8080/d/kubernetes-deployment/kubernetes-deployment
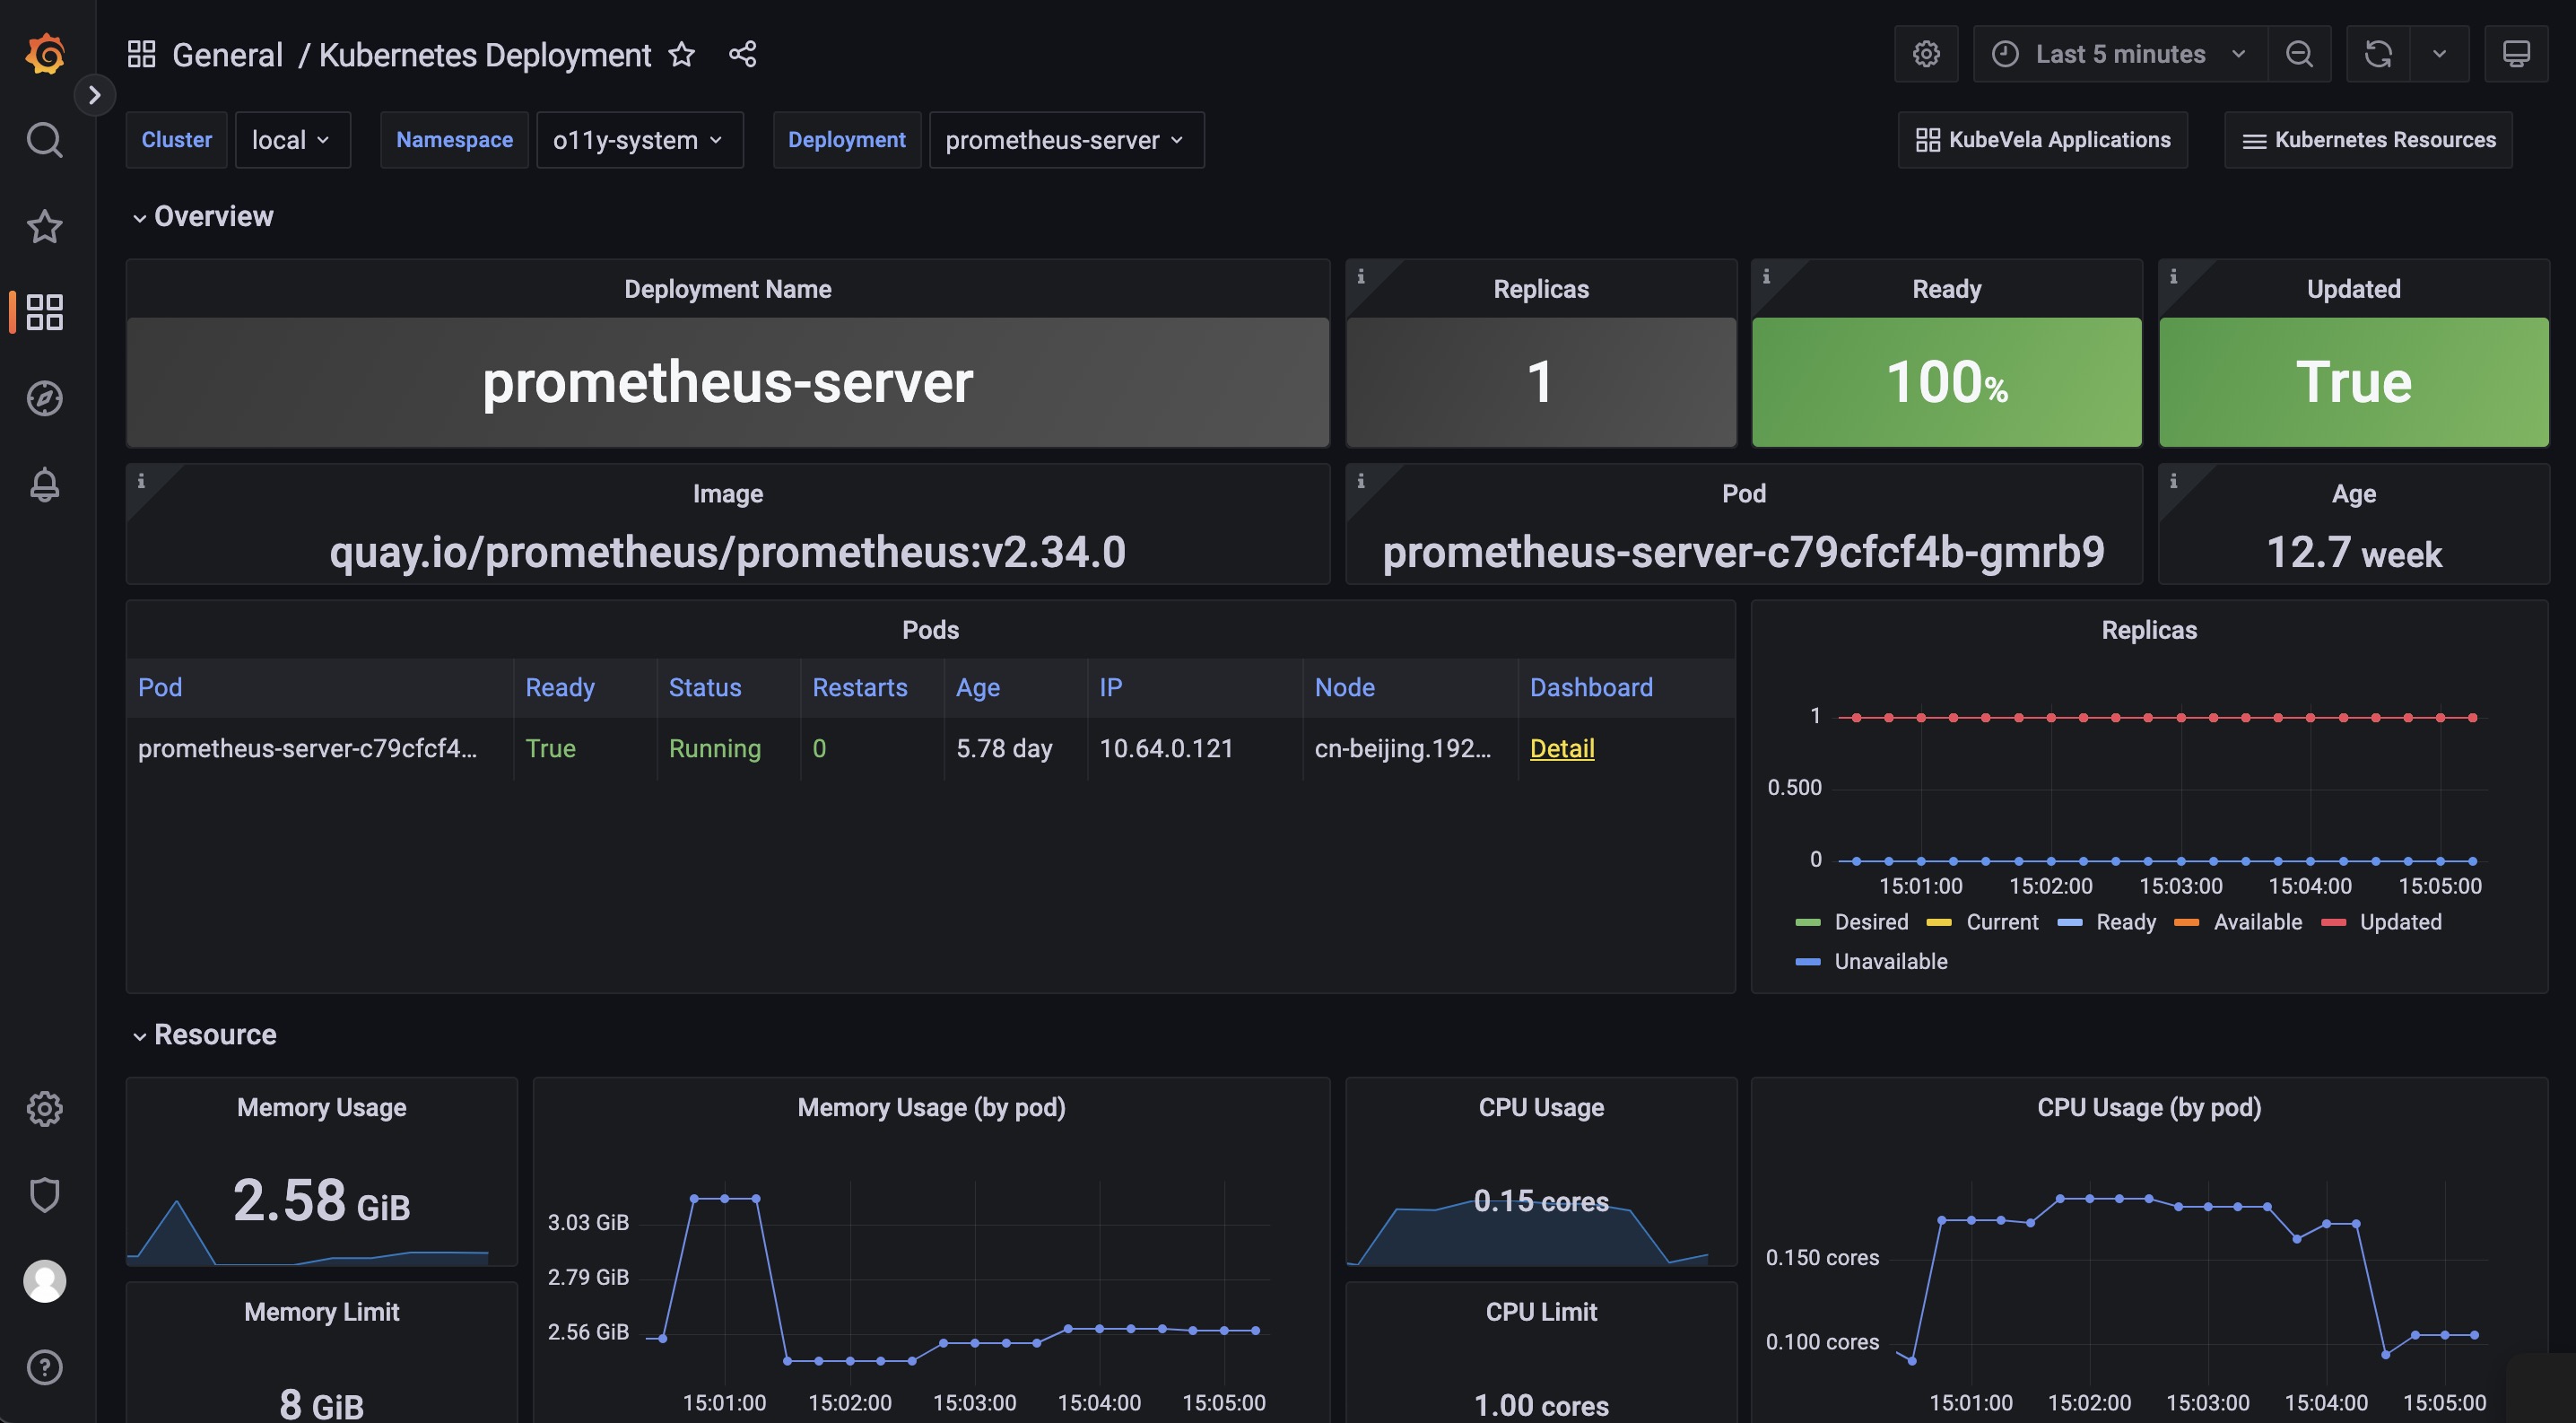
The Kubernetes Deployment dashboard gives you the detail running status for the deployment.
The Pods panel shows the pods that the deployment itself is currently managing.
The Replicas panel shows how the number of replicas changes, which can be used to diagnose when and how your deployment shifted to undesired state.
The Resource section includes the details for the resource usage (including the CPU / Memory / Network / Storage) which can be used to identify if the pods of the deployment are facing resource pressure or making/receiving unexpected traffics.
There are a list of dashboards for various types of Kubernetes resources, such as DaemonSet and StatefulSet. You can navigate to those dashboards depending on your workload type.
KubeVela System
This dashboard shows the overview of the KubeVela system. It can be used to see if KubeVela controller is healthy.
URL: http://localhost:8080/d/kubevela-system/kubevela-system
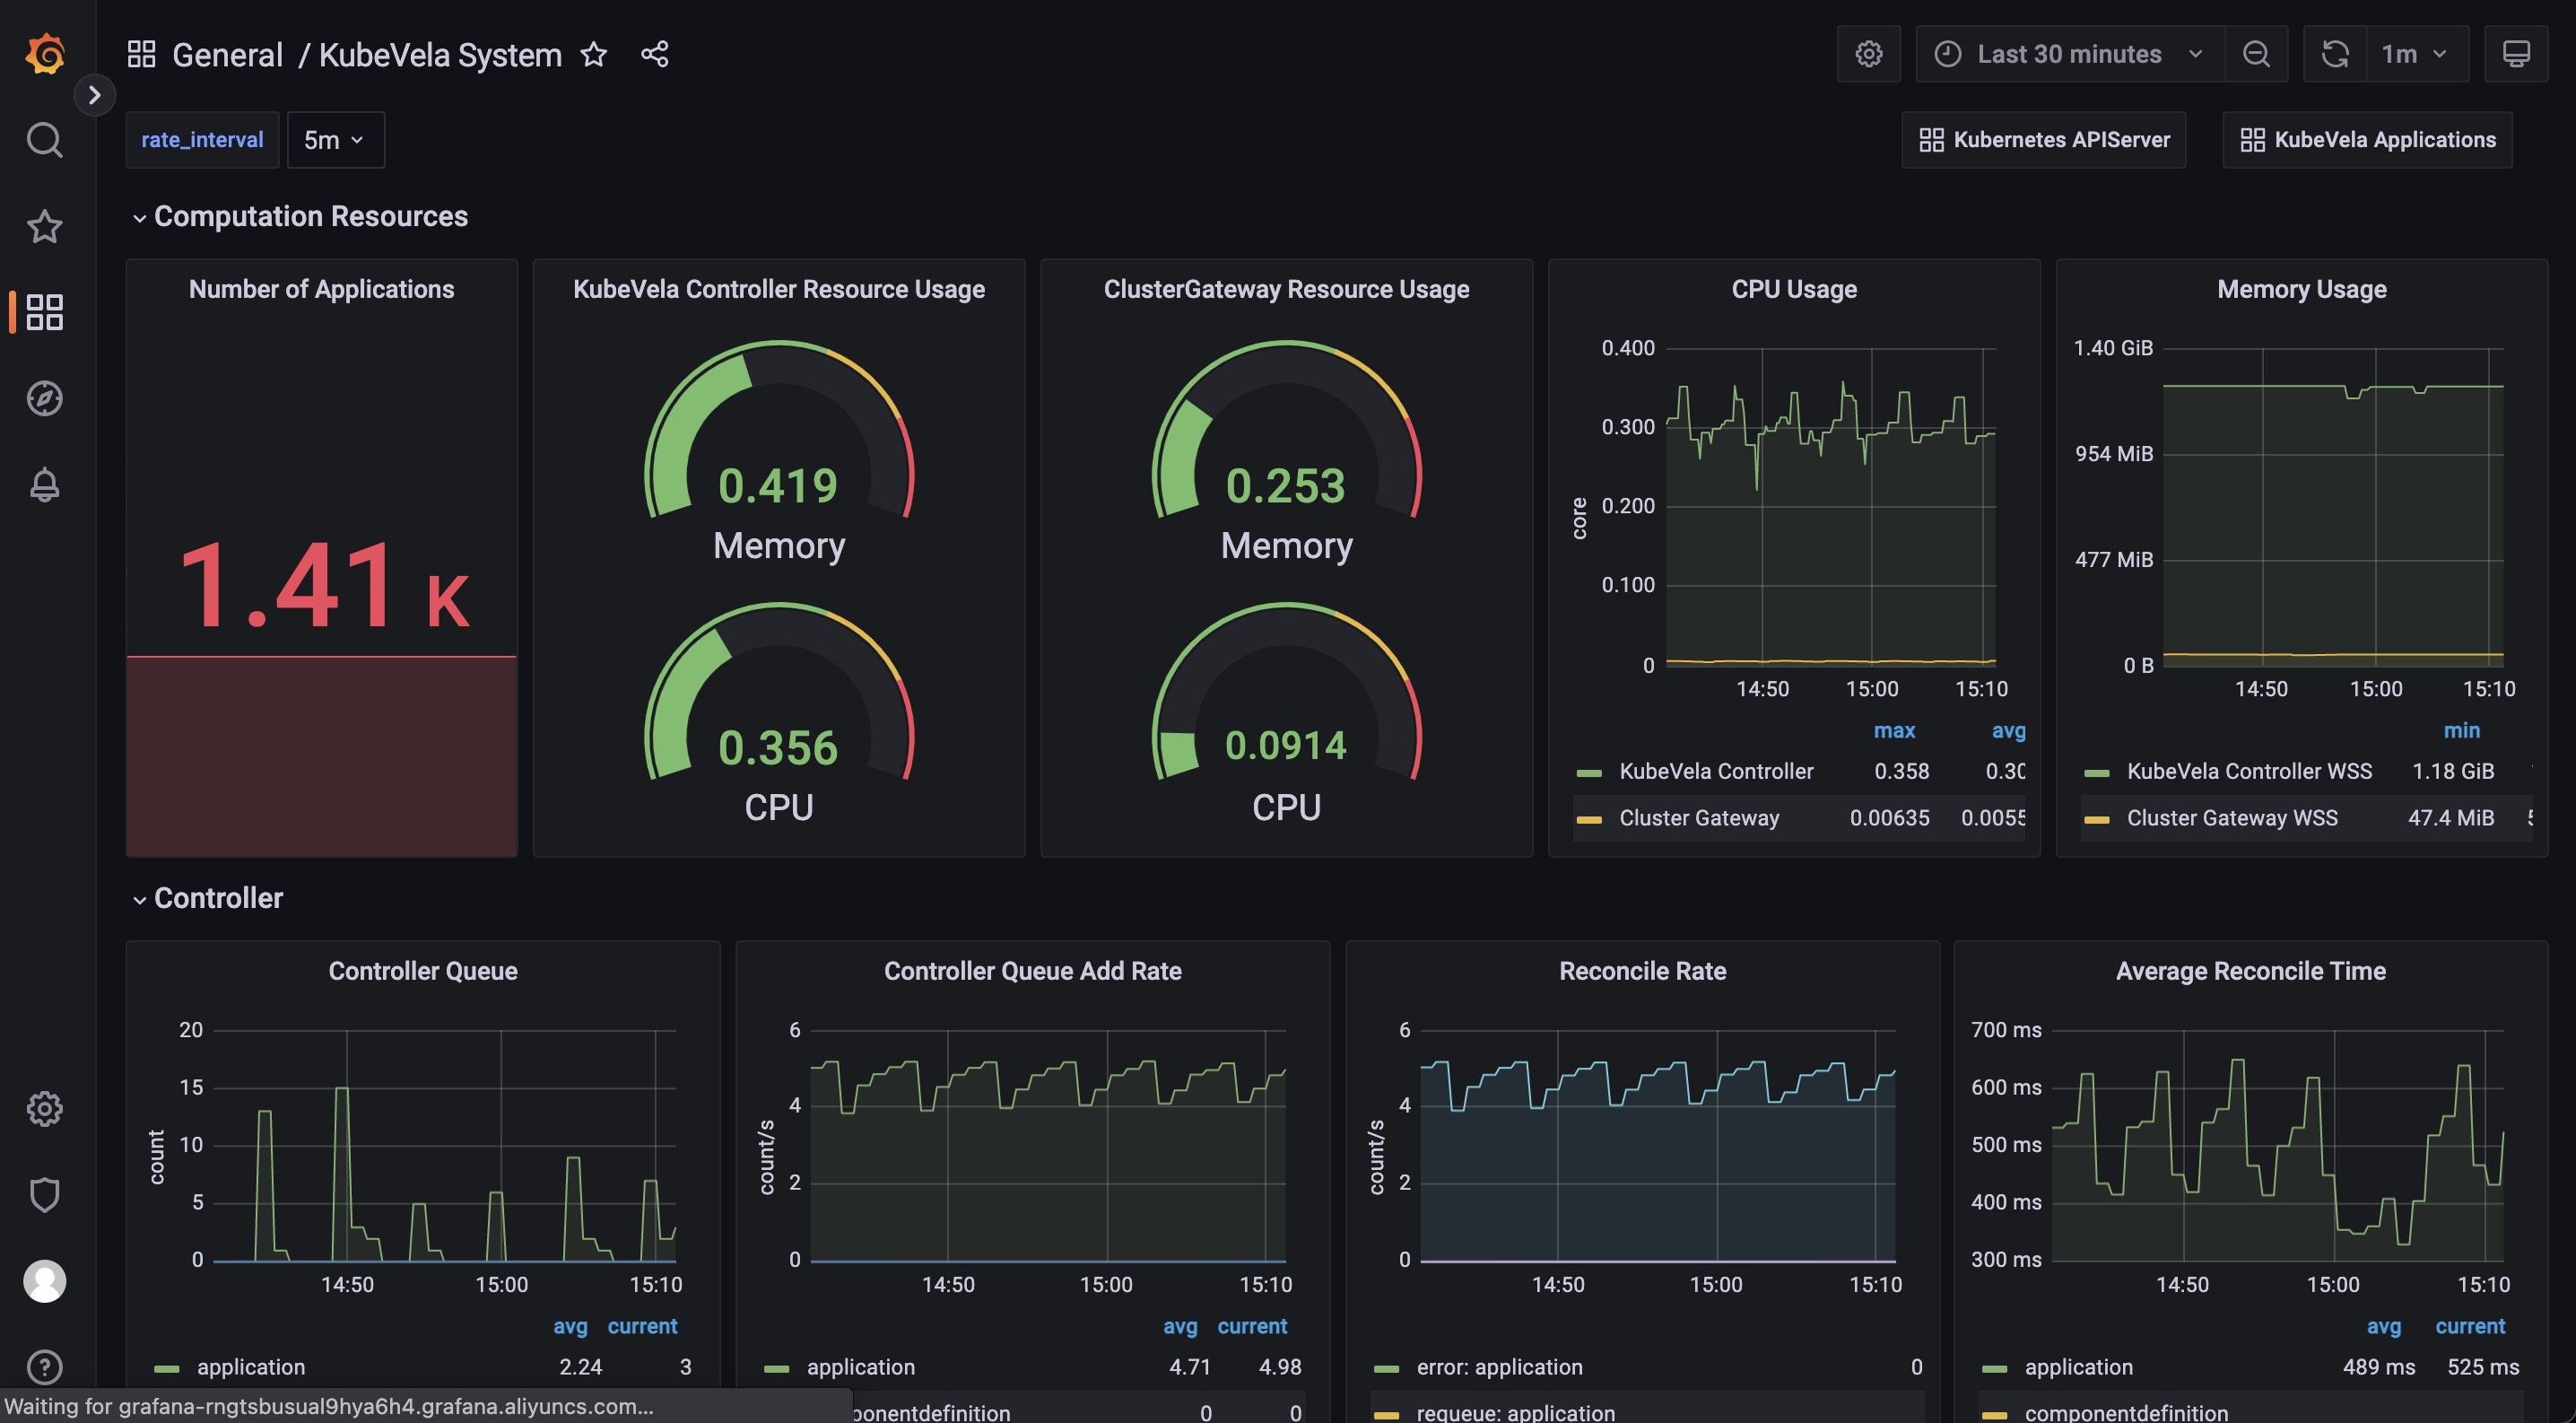
The KubeVela System dashboard gives you the running details of the KubeVela core modules, including the controller and the cluster-gateway. Other modules like velaux or prism are expected to be added in the future.
The Computation Resource section shows the usage for core modules. It can be used to track if there is any memory leak (if the memory usage is continuously increasing) or under high pressure (the cpu usage is always very high). If the memory usage hits the resource limit, the corresponding module will be killed and restarted, which indicates the lack of computation resource. You should add more CPU/Memory for them.
The Controller section includes a wide range of panels which can help you to diagnose the bottleneck of the KubeVela controller in your scenario.
The Controller Queue and Controller Queue Add Rate panels show you the controller working queue changes. If the controller queue is increasing continuously, it means there are too much applications or application changes in the system, and the controller is unable to handle them in time. Then it means there is performance issues for KubeVela controller. A temporary increase for the controller queue is tolerable, but keeping for a long time will lead to memory increase which will finally cause Out-Of-Memory problems.
Reconcile Rate and Average Reconcile Time panels give you the overview of the controller status. If reconcile rate is steady and average reconcile time is reasonable (like under 500ms, depending on your scenario), your KubeVela controller is healthy. If the controller queue add rate is increasing but the reconcile rate does not go up, it will gradually lead to increase for the controller queue and cause troubles. There are various cases that your controller is unhealthy:
- Reconcile is healthy but there are too much applications, you will find everything is okay except the controller queue metrics increasing. Check your CPU/Memory usage for the controller. You might need to add more computation resources.
- Reconcile is not healthy due to too much errors. You will find lots of errors in the Reconcile Rate panel. This means your system is continuously facing process errors for application. It could be caused by invalid application configurations or unexpected errors while running workflows. Check application details and see which applications are causing errors.
- Reconcile is not healthy due to long reconcile times. You need to check ApplicationController Reconcile Time panel and see whether it is a common case (the average reconcile time is high), or only part of your applications have problems (the p95 reconcile time is high). For the former case, usually it is caused by either insufficient CPU (CPU usage is high) or too much requests and rate limited by kube-apiserver (check ApplicationController Client Request Throughput and ApplicationController Client Request Average Time panel and see which resource requests is slow or excessive). For the later case you need to check which application is large and uses lots of time for reconciliations.
Sometimes you might need refer to ApplicationController Reconcile Stage Time and see if there is some special reconcile stages are abnormal. For example, GCResourceTrackers use lots of time means there might be blockings for recycling resource in KubeVela system.
The Application section shows the overview of the applications in your whole KubeVela system. It can be used to see the changes of the application numbers and the used workflow steps. The Workflow Initialize Rate is an auxiliary panel which can be used to see how frequent new workflow execution is launched. The Workflow Average Complete Time can further show how much time it costs to finish the whole workflow.
Kubernetes APIServer
This dashboard shows the running status of all Kubernetes apiservers.
URL: http://localhost:8080/d/kubernetes-apiserver/kubernetes-apiserver
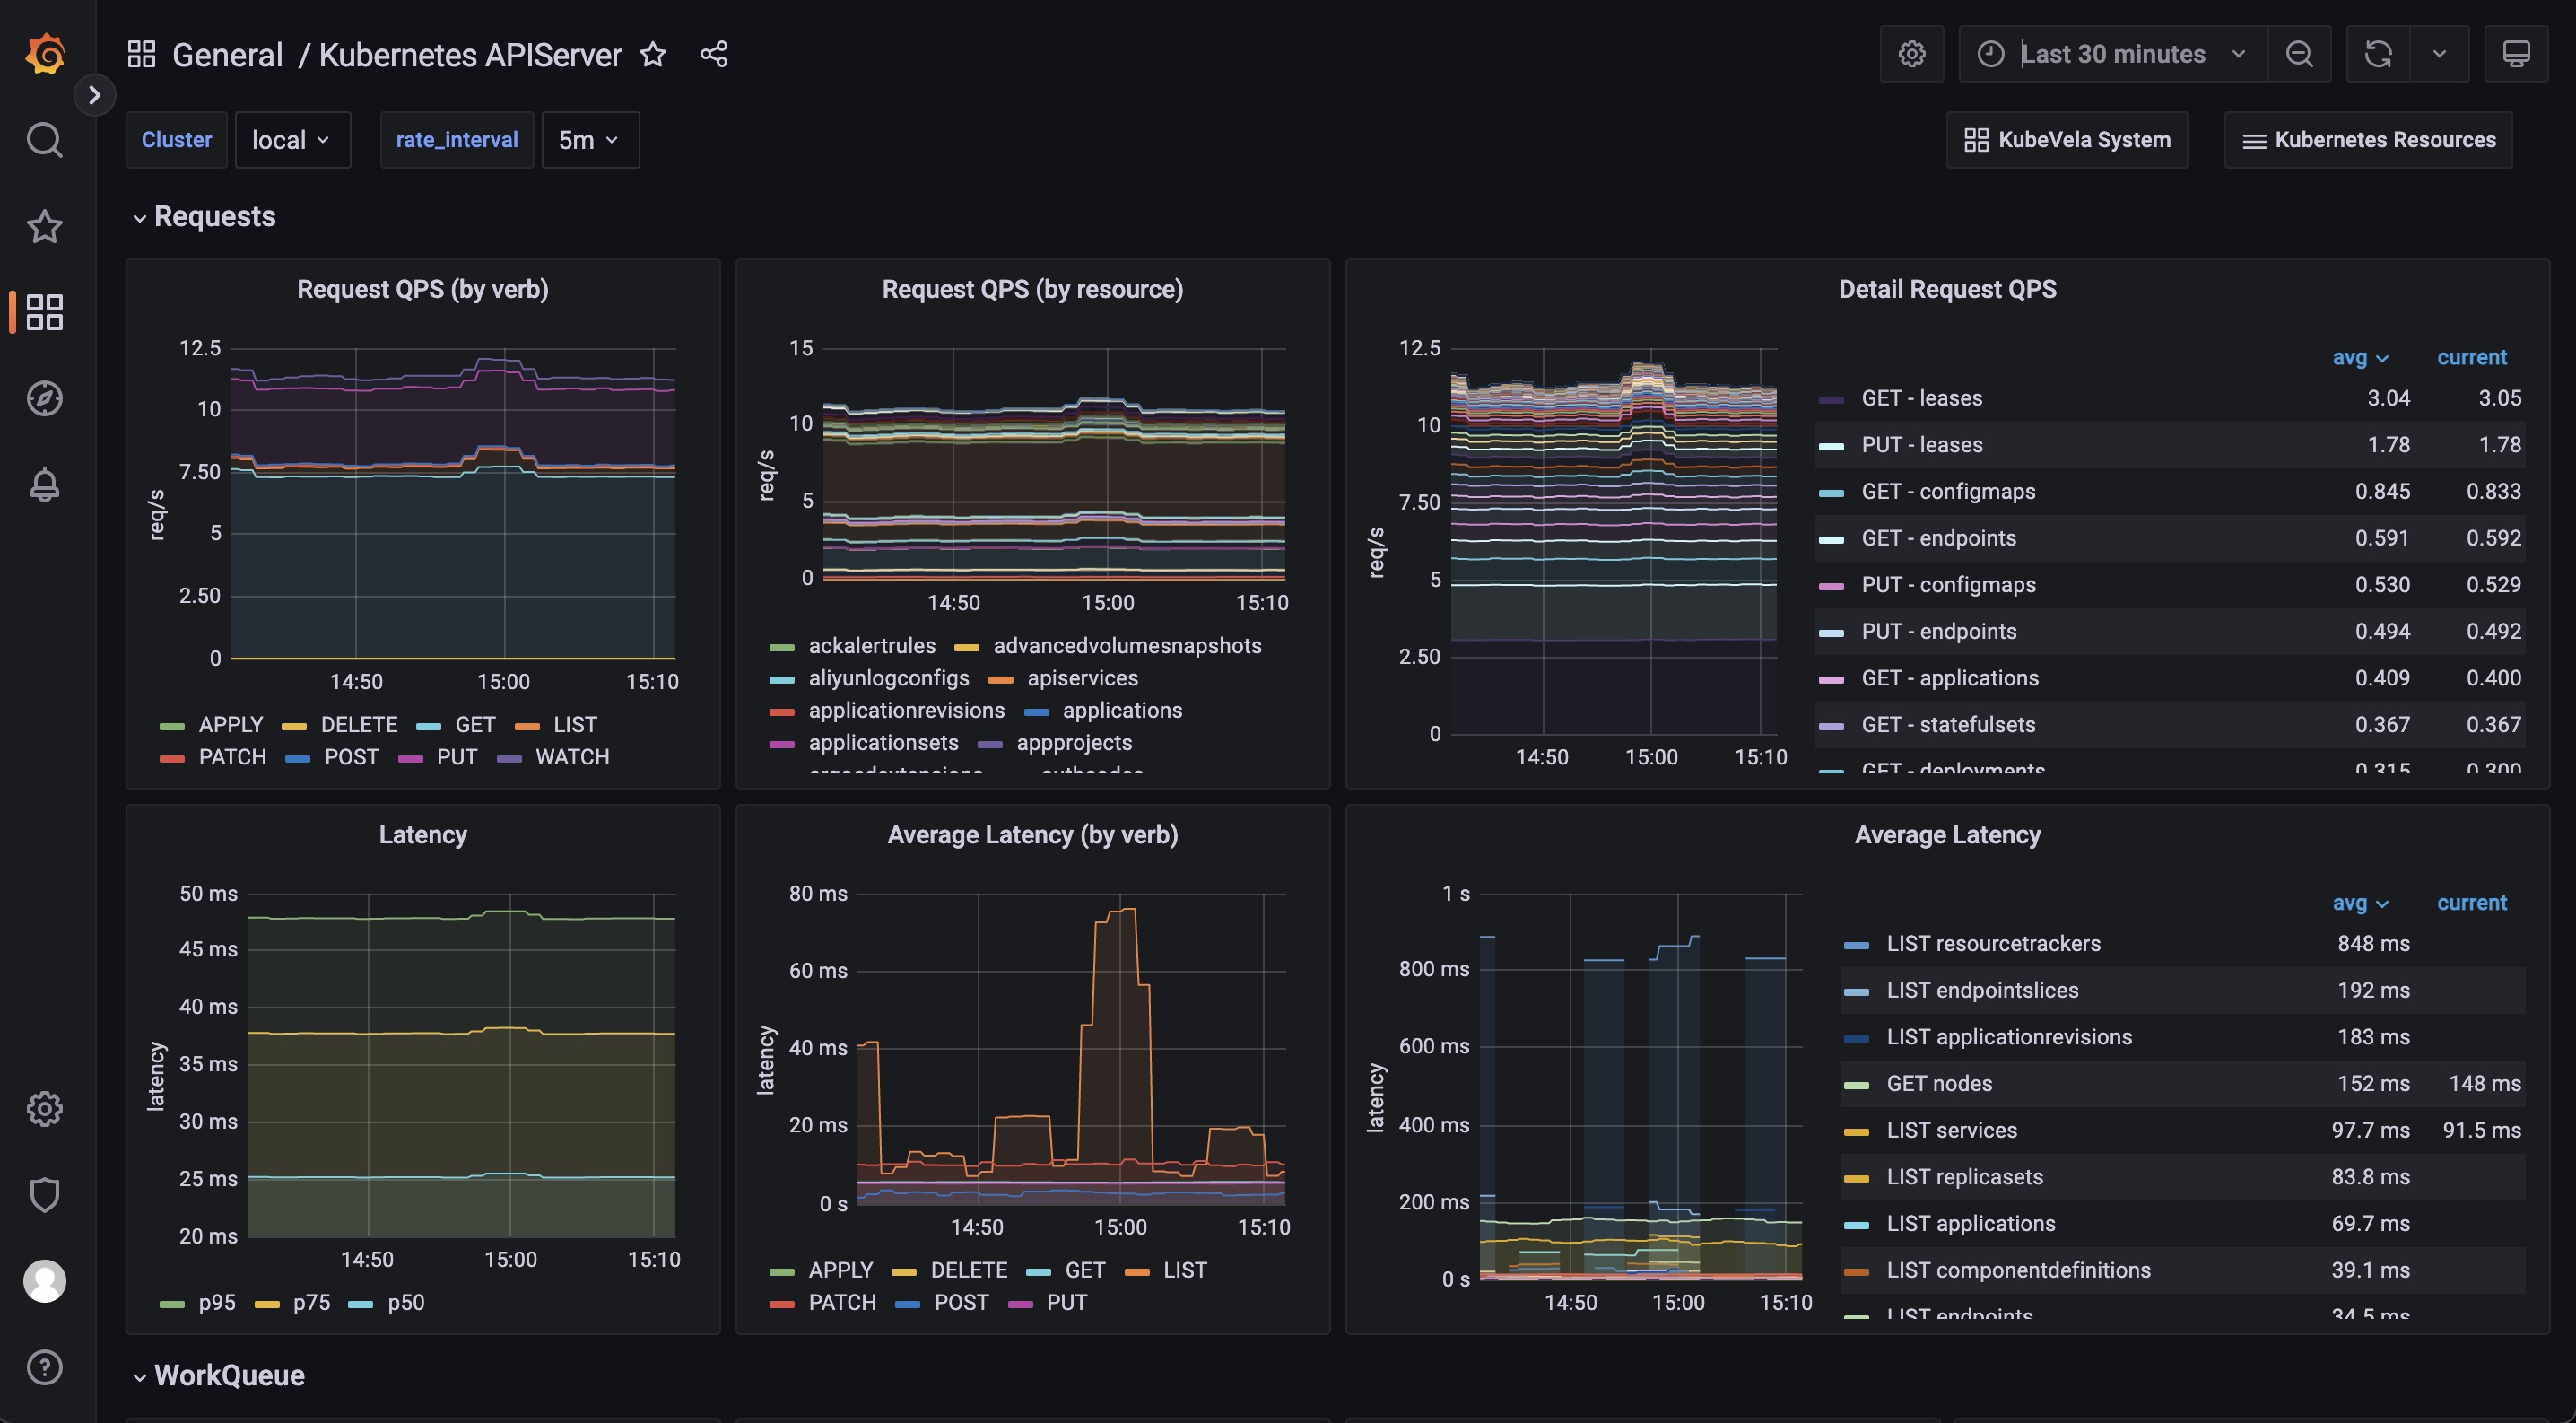
The Kubernetes APIServer dashboard helps you to see the most fundamental part for your Kubernetes system. If your Kubernetes APIServer is not running healthy, all of your controllers and modules in your Kubernetes system will be abnormal and unable to handle requests successfully. So it is important to make sure everything is fine in this dashboard.
The Requests section includes a series of panels which shows the QPS and latency for various kind of requests. Usually your APIServer could fail to respond if it is flooded by too much requests. At this time, you can see which type of requests is causing trouble.
The WorkQueue section shows the process status of the Kubernetes APIServer. If the Queue Size is large, it means the number of requests is out of the process capability of your Kubernetes APIServer.
The Watches section shows the number of watches in your Kubernetes APIServer. Compared to other types of requests, WATCH requests will continuously consume computation resources in Kubernetes APIServer, so it will be helpful to keep the number of watches limited.